
An SEO ROI dashboard earns its keep the moment a finance director opens it without calling you first. Most of the ones I inherit from clients fail that test. They are beautiful, they refresh every morning, and nobody outside the marketing team has looked at them since the week they were built.
I have spent ten years in Barcelona building these reports for clients who range from a single-location dental clinic to a mid-sized SaaS company, and the pattern repeats. The dashboard fails not because the data is wrong, but because it answers a question nobody asked. Rankings went up. Impressions went up. So what? The person paying for the work wants to know whether the money came back, and by how much.
This is the layout I use now, the sources behind each number, and the parts I deliberately leave out. If you need the arithmetic behind the return itself, I covered that separately in my guide to measuring SEO ROI — this piece is about the reporting layer that sits on top of it.
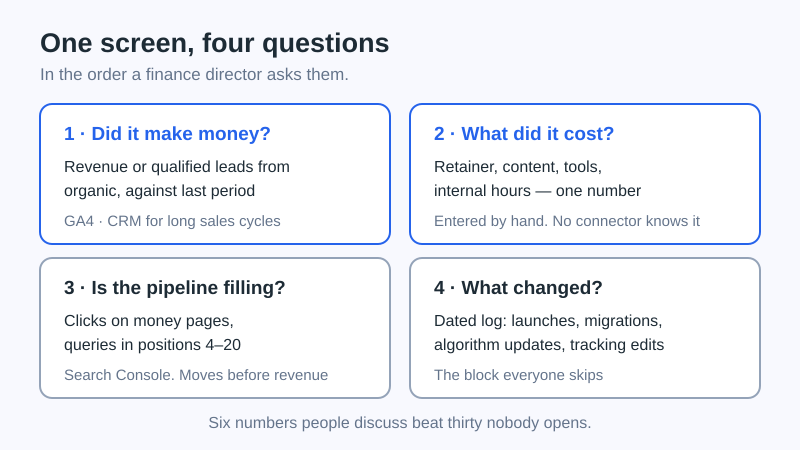
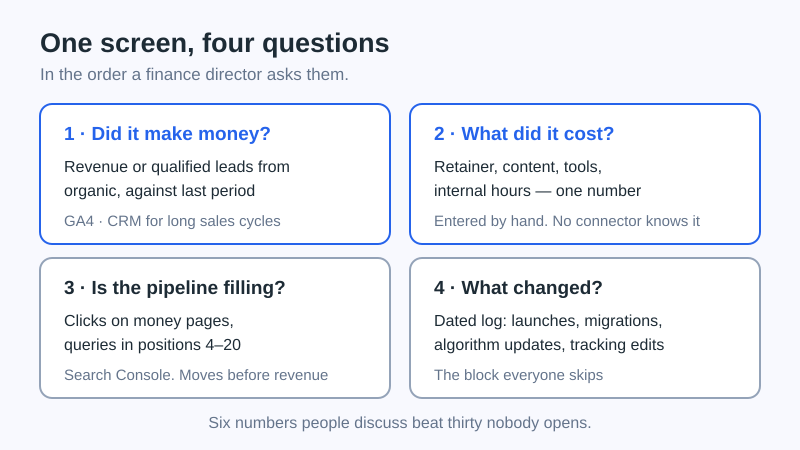
One screen, four questions
A dashboard is not an archive. Mine fits on one screen and answers four questions in the order a non-specialist asks them.
- Did we make money from organic search this period? Revenue or qualified leads from organic sessions, next to the same figure from the previous period.
- What did it cost? Agency retainer, freelance work, content production, tools. One number, updated monthly, no estimates hidden inside it.
- Is the pipeline that produces future revenue still filling? Clicks and impressions on the pages that already convert, not on the whole site.
- What changed, and did we do it? A short annotation log: launches, redesigns, algorithm updates, tracking changes.
The fourth block is the one everybody skips and the one that saves the relationship. When traffic drops 18% in a month, the difference between a calm conversation and a panicked one is a dated line that reads “site migrated to new CMS on the 14th.”
Where each number comes from
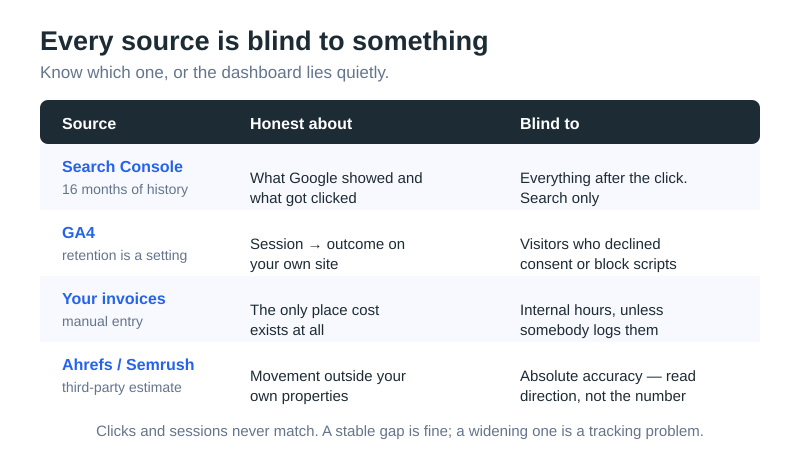
Three sources cover everything above, and each one is honest about something different. Mixing them without knowing which is which is how dashboards start lying quietly.
| Block | Source | What it is good at | Where it misleads |
|---|---|---|---|
| Revenue / leads from organic | GA4, or your CRM if the sales cycle is long | Connecting a session to an outcome on your own site | Consent gaps and ad blockers thin the numbers; last-touch flatters the last click |
| Cost of the work | Your own invoices and payroll | Nothing else knows this — it has to be entered by hand | Forgetting tooling and internal hours makes the return look better than it is |
| Clicks, impressions, position | Search Console | Ground truth for what Google actually showed and what got clicked | Only search; it knows nothing about what happened after the click |
| Backlinks, visibility | Ahrefs, Semrush or similar | Movement you cannot see in your own properties | Third-party estimates; treat direction as real, absolute values as approximate |
Two limits shape how far back the dashboard can look. Search Console keeps 16 months of performance data, so a year-over-year comparison is possible but a three-year trend is not. GA4 gives you a choice of retention for event-level data, and the default is shorter than most people assume — worth checking before you promise anyone a long history.
Expect the two Google properties to disagree. Clicks in Search Console and sessions in GA4 count different things, at different moments, with different consent handling. I have never seen them match and I stopped trying to make them. What matters is that the gap between them stays stable. A widening gap month after month usually means tracking is degrading, not that search is.
The money block, without the fiction
Ecommerce clients make this easy: the order value is real and it sits in the same system as the session. Everyone else has to assign a value to a lead, and that is where most dashboards quietly become fiction.
My rule with lead-generation clients is that I do not invent the number — the client does, and they write it down. Close rate on organic leads over the last twelve months, average deal size, gross margin. Multiply, and you have a value per lead that belongs to the business rather than to me. It gets reviewed twice a year and the date of the last review sits under the figure in the dashboard.
That single habit changes the conversation. When the CFO disagrees with the value per lead, the argument is about their assumption, not about my reporting. I have watched that turn a defensive quarterly review into a productive one more than once.
Attribution deserves the same honesty. Most dashboards run on last non-direct click because it is the default, and the default systematically under-credits everything that happens early in the journey — which is where organic search usually lives. I state the model in the dashboard footer, in one line, and I do not switch models mid-year without annotating the date. Comparing a period measured one way against a period measured another way is the fastest way to lose the room.
Leading indicators that are worth the space
Revenue is a lagging number. If the dashboard shows nothing else, a quiet quarter looks like failure even when the work is landing. The trick is choosing leading indicators that a non-specialist can read without a lesson in search.
Four have survived on my dashboards; everything else I have tried eventually got cut.
- Clicks on money pages. Not sitewide clicks. The ten or fifteen URLs that actually convert, tracked as a group. A blog post about industry news going viral is not progress, and sitewide numbers hide that.
- Pages in the striking zone. How many queries sit between positions four and twenty. This is the closest thing SEO has to a sales pipeline, and it moves months before revenue does.
- Share of branded versus non-branded clicks. Branded search grows when marketing works elsewhere. Separating it stops SEO from taking credit for a television campaign, and stops it from being blamed when brand demand dips.
- Indexed pages that matter. Not the total from a site: query — the count of important URLs that Google has actually indexed. I have picked up more broken deployments from this one line than from any alerting tool.
Rankings for a hand-picked keyword list did not make the cut, and I removed them from client reports years ago. Positions are personalised, localised and volatile, a tracked list is always a sample somebody chose, and the number invites arguments that lead nowhere. Clicks already contain the ranking story, filtered through what people did about it.
Building it without a data team
Looker Studio connects to both Search Console and GA4 for free, and for most businesses that is the whole stack. A spreadsheet works too, and I have kept clients on one for years when the reporting cadence was monthly and the analyst was me.
The part that is genuinely manual is cost. No connector knows your retainer or the twelve hours a developer spent on site speed. I keep a small sheet with one row per month — retainer, content, tools, internal hours — and blend it in. It takes about ten minutes a month and it is the only reason the dashboard can say the word “return” at all.
Free tooling gets you further than people expect here, and I keep a running list of what I actually use in my roundup of free SEO tools. The expensive part of reporting has never been the software.
Mistakes I have made, so you can skip them
Every failed dashboard I have built failed in one of these ways.
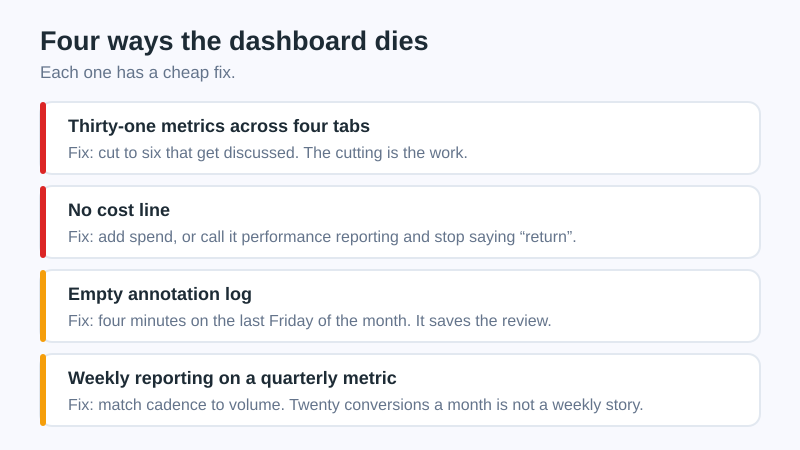
Too many tiles. My worst offender had thirty-one metrics across four tabs. The client opened it twice. A dashboard with six numbers that get discussed beats one with thirty that get ignored, and the discipline of cutting is the actual work.
No cost line. Without spend, there is no return — the report is a traffic dashboard wearing a different name. If the client will not share the budget, I say so in the footer and label the whole thing performance reporting instead.
Nobody writes the annotations. An annotation log that is empty for three months is worse than none, because it implies nothing changed when plenty did. I put a recurring calendar entry on the last Friday of the month and it takes four minutes.
Reporting weekly on a metric that moves quarterly. Weekly organic revenue for a business doing twenty conversions a month is noise presented as signal, and it trains stakeholders to react to randomness. Match the cadence to the volume: weekly for high-traffic ecommerce, monthly for almost everyone else.
One more, which is technical rather than editorial: a dashboard built on a broken tracking setup will report confidently and wrongly for months. Before I connect anything, I run the client’s property through the same checks I describe in my technical SEO audit walkthrough. Duplicate tags and unfiltered internal traffic are the two that quietly ruin the money block.
Common questions
How often should an SEO ROI dashboard update?
Data can refresh daily; the conversation should be monthly for most businesses. Search Console data lags by a couple of days, organic revenue for a considered purchase lands weeks after the visit that started it, and a weekly review of either invites decisions based on noise. High-volume ecommerce is the exception where weekly genuinely carries signal.
What if the client cannot give me revenue data?
Then report qualified leads and label them as such, with the value per lead left blank until the business supplies it. A dashboard that says “we generated 42 qualified leads” is defensible. One that multiplies those leads by a number the agency invented is not, and it collapses the first time somebody in finance asks where the figure came from.
Should rankings appear at all?
In a working session with the SEO team, yes. In the report a stakeholder reads, no. Positions are personalised and volatile, and the tracked list is always a sample someone chose. Clicks and impressions from Search Console tell the same story with fewer arguments attached.
How long before the dashboard shows anything worth reading?
Leading indicators move within a month or two — striking-distance queries and clicks on money pages respond first. Revenue attributable to organic search usually needs two full quarters before the trend is separable from seasonality. Say that out loud at the start of the engagement rather than in month four.
Do I need Looker Studio, or will a spreadsheet do?
A spreadsheet is fine while one person maintains it and the audience is small. Looker Studio starts paying off when several people need the same view on demand, or when copying numbers by hand has started producing mistakes. The tool has never been the reason a report succeeded or failed.
What to build first
If you are starting from nothing, build the cost line before anything else. It is the least interesting part and the one that turns a traffic report into an SEO ROI dashboard. Then add revenue or qualified leads from organic, then clicks on the pages that convert, and stop there for a month to see which numbers people actually ask about.
The dashboards that survive in my client relationships are the small ones, reviewed monthly, with a dated note explaining every strange month. Not the ones with the most tiles. If the finance director can open yours and reach a decision without phoning you, it is doing its job — and if they phone anyway, the missing block is usually the annotation log.